ComCap Main Capture Window ![]()
|
ComCap Main Capture Window |
Top Previous Next |
|
When the ComCap tray version is started, it immediately minimises itself to the system tray, usually in the bottom right of the screen. Left or right clicking on the ComCap icon will open the main ComCap window, with the Capture Log window on the left (first image below) and the Information Log window on the right (second image blow). There is a narrow vertical splitter between the two windows that may be used to adjust the width of each, while the main window can be dragged by its edges or corners to increase or decrease its size.
(Main Window, Left, showing Capture Log Window)
(Main Window, Right, showing Information Log Window), Capture Log (Right Click Menu)
Capture Log Window The Capture Log window is initially empty for a fresh ComCap install, the image above shows one serial COM and many network tabs that have been set-up through Common Settings, Network Channels and Serial Port Channels.
The tabs are coloured to indicate capture state. Silver means all capture is stopped, Blue that the channel is ready to start capture (TCP Server only), Green that data capture has started and Red that capture for that channel has stopped. The brighter colour is the currently selected tab.
Clicking on a tab changes the Capture Log window to the new serial or network channel and loads and displays previously logged data for that channel, if any. This data may be initially several days old, since a new log is not opened until new data is captured. The intention is that any recently captured data can be viewed, even when stopping and restarting capture.
Any channel can also be displayed by selecting it from the main Capture menu, and may be configured from the main Settings menu. The title bar shows the configuration of the current channel:
Capture Log: CDRs COM3 (Serial Port COM3, Speed 9,600 bits/sec), Database: COMCAP
while the panel in the button bar show the current state of the channel:
From: COM3 (OK), Echo: UDP Send to IP 192.168.1.107:514 (OK)
The status bar below the button bar shows the time that the last line was captured, the number of lines captured since starting, optionally the number of rows written to the database, then the file name of the main current file to which this channel is being captured, and finally the date and time at which the capture file name will be rotated and a newly named file opened.
The status bar at the bottom of the window has five coloured indicators labelled CTS, DSR, DCD, RD and Echo which are made active for the current channel. For serial ports, the first three show the status of the Clear To Send, Data Set Ready and Data Carrier Detect signal lines as green (low) or red (high), while for networks CTS indicates listening or attempting to connect, while DSR and DCD indicate an open connection. The fourth Receive Data indicate will flash green for one second as data is received (for data at a rate of one line per second or faster it will stay green), while the first Echo indicator shows white for no echo, green if echo is OK or red if echo has failed. Note the signal indicators are meaningless when capture is stopped.
Right clicking on the Capture Log window displays a pop-up menu that offers further options, depending on whether capture is stopped or started, which are detailed below. Most of these options are also available on the main menus.
Information Log Window The Information Log window shows messages about which channels are being captured and their configuration such as to which log files and databases captured data is being written. Typically, the status information is updated hourly for all channels with cumulative totals, but may be reported at any time by clicking the Status button. Any capture errors are shown in this window. Right clicking on the Information Log window displays a pop-up menu that offers further options which are detailed below.
When the network configuration is loaded, and when capture is started, a warning is logged if a configured local IP no longer exists on the PC, due to networking being changed. Currently, capture will still attempt to start, since other channels may still work, but those channels trying to use a non-existent IP address will give network errors. This mainly effects TCP and UDP server channels set-up to listen on a single IP, rather than 0.0.0.0 for all IPs on the PC. On the other hand, if the PC IP address has changed perhaps due to DCHP being configured, data directed at the original IP address will not arrive anyway.
Start and Stop Capture buttons The Start and Stop buttons allow capture to be started and stopped. The actual action depends on whether the capture is by the Background Service or Tray applications, which is indicated in the status bar at the bottom of the screen on start-up. If using the Background Service, the buttons will start and stop the service, if the logged-on user has the rights to do so (otherwise the buttons are disabled), and will also start the tray version monitoring the service, if so configured. If capturing using the Tray application, capture will immediately start.
When stopping capture, a dialog will appear to ‘Confirm Stop All Captures?’, in case the button is clicked by accident. The confirm stop dialog will also appear when exiting the ComCap Tray version if capture has been started, but not if Background Service is being used.
Status button and Capture Status menu The Status button and Capture Status main menu option are used to log the status of all capture channels, including all the current log files names. This may be configured to occur every hour in Common Settings, Log Files.
Hide button and Hide Main Window menu The Hide button and Hide Main Window file menu options both cause the main window to be minimised to the System Tray, while capture continues.
Stop Capture and Exit, and Exit menu option The Exit file menu option and the X Close button in the top right Window cause the Tray version to terminate. If the Tray version is performing capture, the option will say Stop Capture and Exit and the confirm stop dialog will appear before ComCap is exited.
Capture Right Click Pop-up Menu While the cursor is located within the Capture Log Window, pressing the mouse right click button will display the pop-up menu illustrated above, with lines various greyed or enabled depending on the channel and what is it doing, as detailed individually following below. Some of these menu options are also available on the main Edit, Settings and Capture menu at the top of the window.
Pause Capture and Resume Capture, right click menu These options are only available if capture has been started, and allow a single channel to have capture paused and then resumed. The tab description indicates any channels that are paused. While paused, the Capture Settings may be changed. This option may sometimes to be used to reset a network channel that gets stalled.
Capture Settings menu, right click menu Allows channel specific Capture Settings to be changed. This may be done while capture is running, but if the settings are changed a prompt will appear so capture can be restarted for all channels (after Common Settings) or just this channel to make the new settings effective.
Edit menu options, right click menu There are various option on the Edit and window right click menus, that allow captured data to be selected and copied to the clipboard, Select All, Copy, and Copy All. Clear may be used clear the current Capture Log window, but it will be refreshed if another channel tab is selected and then the current channel reselected.
Stop Window Update, right click menu On the Capture Log window right click menu, Stop Window Update is a toggle option (ticked when set) that temporarily stops display of captured data for the selected channel only.
Auto Scroll, right click menu On the Capture Log window right click menu, toggling Auto Scroll stops ComCap forcing scrolling to the end of the window before adding a new line of captured data. This applies to all channels.
Word Wrap, right click menu On the Capture Log window right click menu, toggling Word Wrap determines whether captured lines are word wrapped to the Capture Log window width, or displayed in a horizontally scrolled window. This applies to all channels.
Scroll Tabs, right click menu On the Capture Log window right click menu, toggling Scroll Tabs determines whether multiple Capture Log window tabs are displayed in two or more rows, or instead horizontally scrolled by the left and right arrows. This will only matter if about four or more channels are captured, where the number of lines of captured data that can be viewed will be reduced as the number of channels increases. But scrolling means the capture state of all channels can no longer be easily checked since many tabs will be hidden. This applies to all channels. This option is set automatically if more than 32 channels are configured, since otherwise there is unlikely to be sufficient screen space to display all the tabs in rows.
Log Font menu, right click menu Allows the font used for the Capture Log and Information Log windows to be separately specified. The Capture Log font must be fixed width, Lucida Console being very readable or else Courier New, usually sized at 8 point. The Information Log window can be any font and defaults to Arial 8 point.
Load Full Log, right click menu Only available when capture is stopped, Load Full Log causes the full current log to be loaded for display. Normally ComCap only displays the last few thousand lines (set in Capture Logging while this option will display all lines in the log in the Capture Log window, which might take a few seconds to display.
Database from Log, right click menu This option allows previously captured data to be added to the database, from the capture log. This is typically done in a recovery situation when a database problem meant data was only captured to a log and not the database. See Capture Settings, Database for more information.
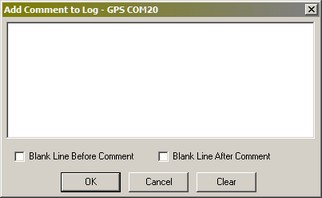
Add Comment to Log, right click menu For some capture applications, it may be useful to add a comment into the capture log. The right click menu Add Comment to Log option causes a small dialog will appear, allowing one or more lines to text to be entered, with tick boxes specifying whether blanks lines should be added before or after the text lines. This feature is intended to assist in documenting batch captures, perhaps from laboratory instruments. Note the added text is processed in the same way as any normal captured line, which might mean serial number or time stamps being added. Add Comment is only available when capturing using the Tray version.
New Capture Log, right click menu Allows a new Capture Log file to be created on demand, rather than according to the normal settings, perhaps so the old log may be checked without worrying about more captured data being added. The Information Log should report the capture log has been rotated and show the old and new log names. The new log will have the current time, which means the Log Name Format must include a time mask, ideally including seconds otherwise this can only be used once a minute.
Resent Start Command, right click menu If a Start Command has been configured, it may be resent using the right click menu option. This may be needed to send data to 'wake-up' a capture device.
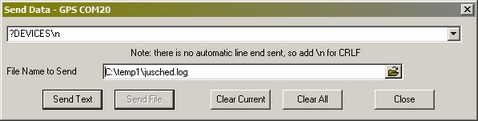
Send Data, right click menu The right click menu Send Data option displays a new window allowing custom data to be sent on demand, with the last 50 command sent selectable from a drop down box. This may be needed to send data to 'wake-up' a capture device. The text entered may include the same escape sequences and pauses as the Start Command, see Capture Settings, General For TCP/UDP only, a file to be selected and sent, typically to configure remote capture device, or load new firmware. Note the file may not contain and escape sequences or pauses.
View Log Window menu and right click menu For improved log viewing, there is also a resizable Log View window. This may be opened from View Log Window on the right click menu when the current capture log will be loaded and displayed, or from View Log Windows on the file menu which will initially display a Select ComCap Log file selection window, allowing any log to selected and displayed. The View Log window includes an Update Current Log (F5) menu option to reload the current log, or another log may be specified and opened.
Telnet Terminal Window, menu and right click menu If this option is taken from the right click menu, it will display the Telnet Terminal window with the IP address defaulted to that of the channel. The Telnet Terminal allows interaction with remote TCP/IP Servers, for testing and configuration. It is only possible to use the Telnet Terminal while capture is stopped.
View Map Window, right click menu If the channel is processing GPS data, clicking this option display the ComCap Map window.
Log GPS Info, right click menu If the channel is processing GPS data, clicking this option will add general GPS information to the info log, depending on the capabilities of the GPS source. For a full NEMA data stream, satellite information is listed:
Satellites in View = 12 Satellites Used = 4 Speed (Knots) = 1.6 True Heading = 85.91 Error Radius = 3.4 Geoidal Separation = 47m PDOP = 4.5 HDOP = 3.4 Satellite 25, Azimuth 267, Elevation 69, S/N 24, Fix Satellite 12, Azimuth 61, Elevation 68, S/N 18, Fix Satellite 14, Azimuth 263, Elevation 49, S/N 27, Fix Satellite 2, Azimuth 97, Elevation 21, S/N 4 Satellite 6, Azimuth 60, Elevation 20, S/N 5 Satellite 29, Azimuth 193, Elevation 23, S/N 4 Satellite 24, Azimuth 129, Elevation 36, S/N 0 Satellite 31, Azimuth 301, Elevation 15, S/N 0 Satellite 4, Azimuth 26, Elevation 7, S/N 0
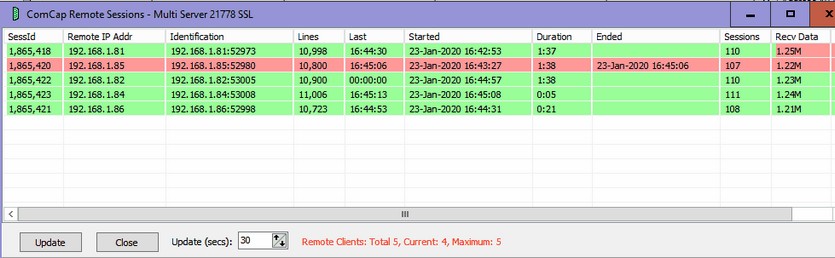
Sessions Window, right click menu For TCP Multi Server channels, a Sessions Window is available that allows easy viewing of remote TCP connections, rather than checking back through the logs.
The Sessions Window is a free floating resizable window listing remote sessions since capture was started. Currently sessions are identified only by remote IP address, so will not distinguish multiple connections from the same remote device. The window shows all remote IP addresses from which data has been captured since the channel was started, one row per remote IP address. Multiple connections from the same remote IP address are consolidated. ComCap allocates a new Session Id for each new connection.
For each remote IP address, the session id is shown, then an identifier combing IP address and port, them the total lines captured, last line time, when the session started and ended (if over), and amount of data captured, all the things shown in the main capture window for individual capture channels.
Active remote sessions are coloured light green, closed sessions light red. There is a right click menu that allows control of individual remote sessions similarly to the main capture window, specifically Close Remote Session, Resend Start Command, Send Data, View Map Window and Log GPS Info, the last two for mapping channels only.
The sessions window is automatically refreshed when a remote connections opens or closes, and also at an optional frequency for progress updates, between every 5 and 300 seconds.
Close Remote Session, right click menu For TCP channels, after a prompt, this options allow closing of the remote connection, perhaps if it seems to have stalled. For TCP Server, hopefully the remote device will attempt to connect again after a few seconds, for TCP Client ComCap will attempt an immediate reconnection, and continue to do so according to specified network retry attempts.
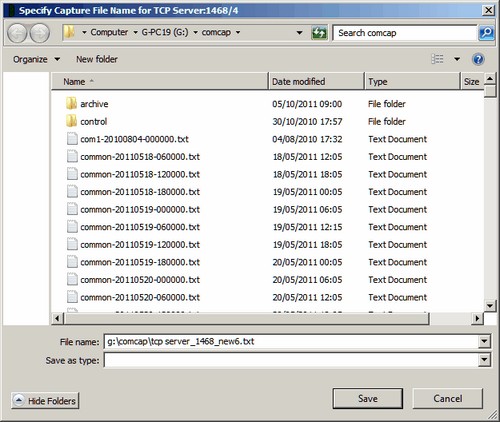
Prompt on Start for File Name One or more capture channels may be specified in Capture Settings, Files to prompt for a specific file name each time capture is started, in which case a dialog similar to the following will appear:
Note that capture will not start until the file name is specified. An existing file name may be used, with captured data added to the end of the file. This feature is intended for applications where data is being captured from a single device for a specific purpose, such as a laboratory test. The 'Add Comment to Log' right menu option might also be useful to add information to the capture log.
|